Vertical axis
First taught in Grades 3–5
The vertical axis is the number line that runs up and down on a graph. On the coordinate plane, it is the **-axis**.
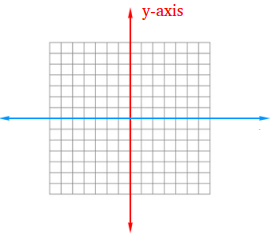
In the figure, the vertical axis is the red line.
On a coordinate plane:
- Values increase going up and decrease going down.
- It crosses the horizontal axis at the origin, .
- Every point on the vertical axis has an -coordinate of 0, like or .
- The second number in an ordered pair tells how far to move along the vertical axis.
On bar graphs and line graphs: the vertical axis usually shows the amount or the dependent variable, such as the number of students, a price or a temperature.
Example: In a bar graph of favorite fruits, the vertical axis shows how many students chose each fruit, and the height of each bar is read against it.
Tips: start the vertical axis at 0 for bar graphs, use equal steps (like 0, 5, 10, 15), and label it with what it measures. A vertical axis that starts above 0 can make small differences look huge.
Where a graph crosses the vertical axis is the Y-intercept. See also horizontal axis.